Home Page
"Join my free Amazing ASP.NET newsletter"
It's safe and easy to signup. You get:
  • Notified anytime a new article comes out
  • Technical step-by-step tutorials on all important ASP.NET topics
  • Expert guidance so you can reach unlimited ASP.NET success
  • Important ASP.NET news updates
Enter your Email

As we saw in earlier lessons, Visual Web Developer opens with some default working windows when you create or open a web site project.  These windows are the Toolbox, the Properties, the Solution Explorer and the Code Editor.  There may be other windows that you use as well while you are developing.  Sometimes you might close one of these windows by accident or the window may not be showing in your IDE.  In either case, it is very easy to bring back these windows if you don’t see them by using the View menu.

For example, if you do not see the Toolbox window open in your IDE, click on the View menu and choose the “Toolbox” option.  For the Solution Explorer choose the “Solution Explorer” option.  For the Properties windows choose the “Properties Window” option.  It is that easy.  Watch this sample video as I close the Toolbox and Properties windows and then bring them back by using the View menu.

Every web site project in Visual Web Developer and Visual Studio has a Start Page.  The Start Page is the .aspx page that Visual Web Developer will open in your web browser when you run the application by clicking the play button.  You can change the Start Page for a web site project by right clicking on the .aspx file in the Solution Explorer that you wish to set as the Start Page and choosing the option “Set As Start Page”.  Watch this sample video to see how I set Default2.aspx as the Start Page and then run the application.  Then I set Default.aspx as the Start Page and run the application again.

**Keep in mind that setting the start page in Visual Web Developer or Visual Studio does not affect your web site deployment into IIS when you publish your project.  IIS has its own default web page that you can change using the IIS administration panel.  The start page in Visual Web Developer only affects your development environment when you run the application using Visual Web Developer.

Debugging your C# program consists of monitoring the execution of the source code as the program is running.  Visual Web Developer has a debugger full of useful features.  The main point of debugging your source code is to determine whether or not it is behaving the way that you expected when you programmed it.  Not only can you go through the code to find problems or fix bugs, but you can also use the debugger to validate that the code is behaving exactly as you had intended it.  This is especially useful in more complicated blocks of code or blocks of code that rely on external resources to make a decision.  A good example is with database programming, where you may not have any idea ahead of time what the data will look like ahead of time, or whether certain fields will contain nulls, so you can use the debugger as your program runs to walk through different scenarios.  I want to make the point that the debugger is not just for situations where something is broken and you can use it for so much more than that.

Using the debugger is very easy.  You first need to determine what part of your program you want to examine.  Then you choose a line of code that you want the debugger to stop at and set what is called a “breakpoint”.  A breakpoint is a line of code in your program that the .NET engine knows to stop at when the program is running.  When the program actually runs, the .NET engine will stop the program at the breakpoint, minimize the web browser and open up the code editor window at the line where the breakpoint resides.  The breakpoint line will be highlighted by the debugger so that you know the program has stopped there.

Once the debugger has stopped at the breakpoint, you can use the debugger to do a number of things.  You can look at the values of the variables in your code by placing the cursor directly over the variable in the code.  The debugger also lists all the variables in your code inside the Locals window and you can use the to see the values of the variables as well.

To move to the next line of code you must use the Step Over button in the toolbar or press the F10 key.  You can keep stepping over each line of code and examine how the program is behaving.  If you want to stop debugging and go back to running the program just press the play button which will have the tooltip of “Continue” when the debugger is running.  All of the debugger functions such as Step Over and Continue are also available from the Debug menu.  Click here to see a sample video demonstrating how to use the debugger.

In C#, comments are blocks of code that are marked with the characters “//” and are ignored by the compiler.  Comments are used to either put documentation into your program or make some lines of code inactive.  For example you may want to add a comment above some of your source code that describes specifically what that part of the program does.  This is very useful even for yourself so that when you come back to your source code later, you can quickly remember why or how you programmed something.  Another example of comment use is to mark some of your lines of code as inactive so that the compiler ignores them.

To create comments you have two options.  You can type “//” on a blank line in the code editor and then type whatever text you want following that to complete the comment.  You can also highlight a block of source code and push the comment button on the toolbar at the top of Visual Web Developer.  The comment button tooltip says “Comment out the selected lines”.  There is also an uncomment button next to it which does the reverse and removes the comment characters from a block of code.  When you use the comment button in the toolbar, all it does is add the “//” characters to the beginning of each line of code that you have highlighted.  Click here to watch a sample video where I add comments to my program using both techniques.  Notice that I also use the uncomment button.

Here are some tips and techniques for using comments:

  • A very common way to use comments is to place them above variable declarations.  We will see examples of this usage of comments in a later lesson entitled “Data types lab exercise”.
  • When you are coding a complicated program and you need to compile the application, but there are sections that you are unsure about.  You can comment those sections out temporarily and perform a compile.  This is especially handy if you have an idea in your head and you want to start programming it, but you don’t have time to finish it so you temporarily comment it out so that you don’t lose the idea.
  • If you are programming a module and you are referring to an example from a book or website, you can paste the example code into your program and comment it out so that the compiler can ignore it.  I use this technique a lot and I recommend that beginning programmers do that as well.  Sometimes I permanently leave the reference material as comments in my program just so that I can keep track historically of where I got it from. 

When you compile your web site program, you may find that the compiler spotted syntax errors in your source code.  The compiler will list each syntax error separately and give you the opportunity to fix each one in any order that you want.  If you double click on the error in the Error List window, Visual Web Developer will take you directly to the problem and give you the opportunity to fix it.  Click here to watch a sample video.

Some common compiler errors for beginning programmers that I have noticed in the classrom are:

  • Using the wrong case when referring to an object.  C# is case sensitive and you have to make sure you use the correct case (uppercase versus lowercase) when you use a variable or refer to something.  TextBox1 is different than textbox1.  When you are typing in the code editor, Visual Web Developer offers the sensitive box that pops up and gives you a list of available objects to choose from so that you don’t have to type in the entire object you are referencing.  I recommend that you use this pop up box to avoid problems with case.
  • Forgetting semi-colons at the end of a statement.  C# requires that you end your statements with a semi-colon.
  • Forgetting to put a closing parentheses ) in a statement.  This is especially important in statements that have embedded multiple parentheses such as ((.
  • Forgetting to put a closing curly brace } at the end of a block of code.  You should pay close attention to this one because I noticed that this common problem is a bit harder to recognize for some beginning programmers and the compiler may not be able to point you to the exact line where the problem occured.

When you are programming C# in Visual Web Developer, I recommend that you compile your source code periodically to ensure that you are on the right track and don’t have any syntax errors in your code.  Normally, when you click the play button at the top as we did in the previous lessons, the Visual Web Developer software will automatically compile the project for you before it runs the web site.  There will be situations where you don’t want to run the program yet, but just want to execute the compiler to check for syntax errors.  A good example is the situation where you are not finished coding a particular set of code, but need to check the syntax.

**For beginning programmers I recommend that you check your syntax very often by executing the compiler.  This is so that you can fix problems before your program becomes too large and then it will be harder to fix since there is more code to examine for problems.  It is much easier to fix syntax errors incrementally.  Although I say that this recommendation is especially for beginning programmers, I personally still perform syntax checks periodically as I code for the reasons mentioned here; it just makes the overall programming process go much smoother.

To execute the compiler without running the project, right click on the project name in the Solution Explorer and choose the Build Web Site option.  The compiler will open an Output window at the botton of the code editor window and you should see something similar to “Build: 1 succeeded or up-to-date, 0 failed, 0 skipped”.  Notice that it says “succeeded” which lets you know that you did not have any compile errors.  Click here to watch the sample video.  In the next lesson we will discuss how to fix compiler errors.

There are two modes that Visual Web Developer and Visual Studio have: Edit mode and Run mode.  Edit mode is active when you are not running the web site and you are editing the code, or any of the files contained within your web site.  Run mode is active when you click the play button and bring up your web browser.  When Visual Web Developer is in Run mode, some of the functionality in the IDE is not available and either becomes hidden or disabled.  An example of this is the Toolbox window which gets hidden when you are running the project.  This is by design.  The designers of Visual Web Developer do not want you editing the project while it is being unit tested.  While technically you can edit some of the files as the program is being run, just remember that some of the functionality of the IDE will be disabled until you get out of Run mode.  To end Run mode and go back into Edit mode, all you have to do is close your web browser.  Once back in Edit mode, all the windows and other functionality should be available again.  Click here to watch a sample video where I start the web application into Run mode and then close my web browser to go back into Edit mode.

When you have finished making edits to your web site in the Visual Web Developer Express IDE, you will need to run your application so that you can verify that it works as expected.  To run the application click the green play button at the top of the IDE.  The button looks similar to a play button on a CD player and if you put your cursor over it, it will say “Start Debugging” in the tooltip.  **The first time you run the web site, you will be asked if you want to enable debugging.  Choose the Modify the Web.config file to enable debugging option and click OK.

Visual Web Developer will launch your web browser to the following URL: http://localhost:1833/YourApplication/Default.aspx.  The port number 1833 may be different on your computer and the application name YourApplication will be different as well, depending on what you named your web site.  Default.aspx is the name of the default web form that is set as the Start Page for the web site.  We will learn how to change the default start page later.

Once the web form comes up, you should be able to begin interacting with your web site, by clicking buttons and whatever other controls your web forms contain.  At this point you can perform unit tests to make sure that your code is behaving as expected.

When you run your web site in Visual Web Developer you will notice that a new small icon gets created in your task bar and if you position your cursor over it the tooltip says “ASP.NET Development Server”.  That application is a mini version of Internet Information Server (IIS) that Visual Web Developer and Visual Studio contain to allow you to unit test your web site without having to install IIS on your computer.  This feature makes programming and testing ASP.NET web applications easier than ever.  Click here to watch the sample video for this lesson.

The Properties window is used when you need to edit how a visual control looks on the web page.  Each control has several properties that define how it appears and behaves in your web application.  For example, you can change the text on the face of a button control or modify the font weight of the button.  In order to modify a control’s properties, click on the control and then use the Properties window to make the necessary edits.  Click here to watch the video.

The Toolbox contains all the visual controls that you can put on your web page.  To add a new control, drag it from the Toolbox right onto your web page.  The Toolbox contains different categories of controls but the most common ones are placed in the category called Standard.  Note that in order to use the Toolbox, you must have the .aspx file open in the Code Editor.  If you have the .cs file open, you will notice that the Toolbox does not show any controls.  Click here to watch the video.

The Code Editor window is where you can edit the artifacts and source code in your project.  In this lesson we focus on how you can edit a web page in your project.

Multiple tabs (watch video)
Each file that you open using the Solution Explorer creates a new Tab in the Code Editor.  The tabs at the top of the Code Editor allow you to flip back and forth between several files open at once.  Each tab contains the file name so that you can distinguish between files.

Design view versus Source view for ASP.NET web pages (watch video)
When you are editing an ASP.NET web page in the Code Editor, you can switch back and forth between a few different views.  The first is the Design view which shows you what the web page will look like when the web application runs in the browser.  This is a visually oriented view where the developer drags items onto the view and then edits the properties of various objects on the web page.  Another view of a web page is the Source view which shows you the raw HTML code for the web page.  To switch between the Design view and Source view, you can click the corresponding selection at the bottom of the Code Editor.  There is also a third view called Split that is a combination of the two other views and can sometimes be useful.

Editing the .aspx web page versus the .cs code behind file (watch video)
If you remember from earlier in the lessons we mentioned that an ASP.NET web page is actually separated into two distinct files: the .aspx file which is the visual presentation of the web page and the .cs file which is the C# source code of the web page.  When you are working on a web page, you will work with both of these files.  If you want to change how the web page looks or add new controls onto the web page, you will edit the .aspx file.  If you need to change the source code or actions that the web page performs, you will edit the .cs file.  Watch the video as I switch back and forth between the two.

By using the Solution Explorer you can edit the various artifacts in your project.  Double click on an artifact in the Solution Explorer in order to open it up in the Code Editor window.  The Solution Explorer can be used to copy, delete and add new artifacts to the project.  Watch as I perform the following actions using the Solution Explorer:

1) Open the source code for the file Default.aspx (by double clicking)
2) Open the configuration file web.config (by double clicking)
3) Copy and paste the web page Default.aspx (using right click)
4) Delete the newly created file “Copy of Default.aspx” (using right click)

Before you begin learning C# and performing the exercises on this website, you should be comfortable with some basic concepts of the Visual Web Developer or Visual Studio software.  In this lesson I will cover the important aspects of the Integrated Development Environment (IDE).  The IDE has lots of features, toolbars and different windows.  You don’t need to understand all of them in order to become proficient with C# and .NET.  Make it a goal to learn the basics that we cover here first and then try to explore one new feature of the IDE each week on your own as you continue to improve your skills in the .NET environment.

First a word about the design of web pages in ASP.NET and how that relates to using the IDE.  When you create a web page (a.k.a. web form) in ASP.NET, you should always choose the option to “Place code in a separate file”.  This means that the source code for the web page that you created, gets put into its own file, separate from the presentation file.  In ASP.NET, the presentation of a web page is split into two files: the .aspx file and the .cs file.  The .aspx file contains some HTML tags, along with some special ASP.NET tags called server controls.  The .cs file contains C# source code that can be called from the .aspx file whenever a button is clicked (or another event occurs in the web application).  These two files need each other and do not work independently.  When you are developing a web page in ASP.NET using the IDE, you have to switch back and forth from editing the .aspx file to editing the .cs file.  The .cs file is also referred to as the code behind file.  Microsoft designed these two separate files so that you can separate your application’s look and feel, from the programming behind it.  This makes development and maintenance straightforward.

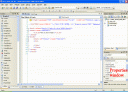
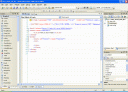
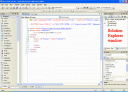
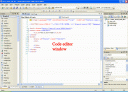
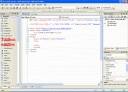
In the following sections I will go over the four basic windows in the Visual Web Developer IDE.  Each window in the IDE has its own distinct purpose.  When you open Visual Web Developer and create your first new web site you will see that four windows open up and your IDE looks like this:
Visual Web Developer

The Solution Explorer window
The Solution Explorer is the little window in the upper right of the IDE.  The Solution Explorer lists all the various project artifacts for your web site such as .aspx files, .cs files, .config files, resource files such as images, references and more.  The Solution Explorer allows the developer to navigate around the project and edit the various files that the project contains.  A web site “project” is a collection of related files and resources that make up a web application.
Solution Explorer

The Code Editor window
The Code Editor is the larger window in the middle of the IDE.  The Code Editor window is where you actually make changes to the look and feel of your ASP.NET web pages and edit the C# source code that runs in your web site.  This is the window where you will spend most of your time.
Code editor

The Toolbox window
The Toolbox is the long window on the left hand side of the IDE.  The Toolbox contains server controls that can be added to your web pages.  Examples of server controls you can use are labels, text boxes, buttons and drop down boxes.  The items shown in the Toolbox are dragged onto your web pages when you want to use them.
Toolbox

The Properties window
The Properties window can be found in the lower right side of the IDE.  This window allows you to change the look and feel of objects that are contained in your web pages.  For example, you can use the Properties window to change the font for a text box on one of your web pages.
Properties